
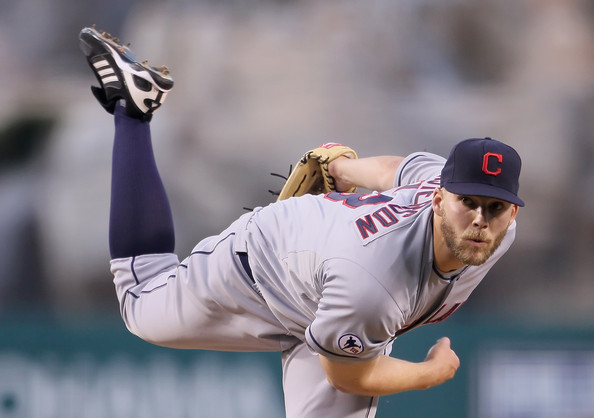
 With their projected starting rotation, it’s unlikely that the Indians have delusions of grandeur about their chances of winning the American League Central Division. It will take quite a bit of overachieving from a group featuring Justin Masterson as its de facto ace for the Indians to truly challenge the Detroit Tigers. That hasn’t stopped the front office from spending a lot of money to improve the lineup and add a veteran starting pitcher to the rotation. A lot of people have criticized the Indians for spending so much money when they have too many holes to contend, but they’re using recent history as a guide. Very recent history, in fact. As recent as the 2012 season.
On April 4, 2012, ESPN.com posted their “expert” predictions for the division winners, wild cards, playoff series winners, and the World Series winner. Fifty “experts” from various baseball backgrounds, including former players Aaron Boone, Doug Glanville, Rick Sutcliffe, and Curt Schilling, ESPN personalities Karl Ravech, Peter Gammons, Buster Olney, and Keith Law, sabermetric minds Dave Cameron of Fangraphs, Jonah Keri of Grantland, and Dan Szymborski of Baseball Think Factory, and even new Tribe skipper Terry Francona, all submitted their picks. Not one picked the Baltimore Orioles or the Oakland Athletics to make the playoffs.
The 2012 season was the first season that saw two wild card teams participate in a play-in round to see who would make it into the divisional series. This opened up a new world of possibilities for the teams in each league. In some divisions, under the old format, the only way to make the playoffs was by winning your division. The payroll disparities in baseball made it hard for smaller market teams to have a shot at the playoffs. This play-in round would change that, giving David one chance to slay Goliath and gain entry into the postseason.
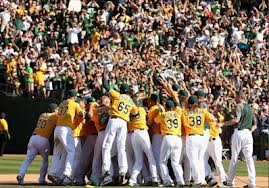
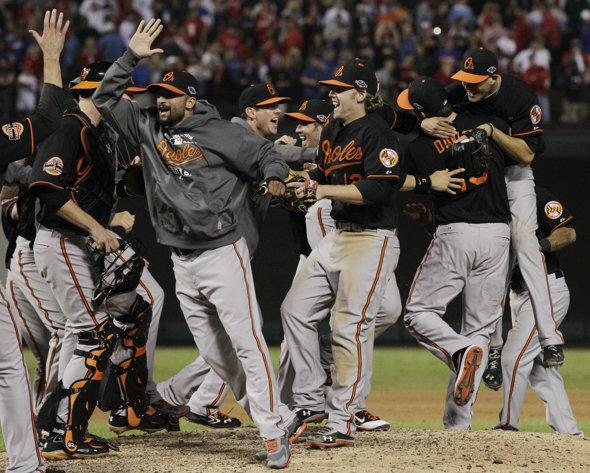
As fate would have it, the Oakland Athletics didn’t need this new wild card spot to punch their ticket for the October fun. They won the American League West in thrilling fashion, leaving the Los Angeles Angels of Anaheim and their $254 million dollar man, Albert Pujols, at home in October. The Baltimore Orioles, an afterthought in the American League East for the last 15 years, went on a torrid 38-20 tear to end the regular season and snatch the second wild card spot. To top it off, the Orioles went on the road to Texas and beat the heavily-favored Rangers 5-1 in the wild card play-in game, after the Rangers choked away the AL West crown against the Athletics a few nights earlier.
Why did not a single one of the 50 people asked in the ESPN predictions pick the A’s or the Orioles? On paper, they didn’t stack up to the other teams in the American League. The A’s 2011 offseason consisted of trading Gio Gonzalez and Trevor Cahill, the team’s #1 and #2 starters, losing Josh Willingham to free agency, trading their closer, Andrew Bailey, to the Red Sox, and the big offseason acquisition was signing a Cuban import named Yoenis Cespedes, who, scouting reports said, couldn’t hit a breaking ball. In the trades, the A’s wound up with Tommy Milone, a standard issue, run-of-the-mill left hander who didn’t walk batters and also never touched 90 miles per hour on the radar gun, Jarrod Parker, a highly-touted pitching prospect who had all of one start of Major League experience, Josh Reddick, a Red Sox cast-off with less than 400 Major League at bats and a strikeout-to-walk ratio of nearly 4:1, and a hard-throwing righty named Ryan Cook, who had started the previous season in Double-A and allowed 19 baserunners in 7.2 innings in his brief seven-game stint in the Majors to end the season.
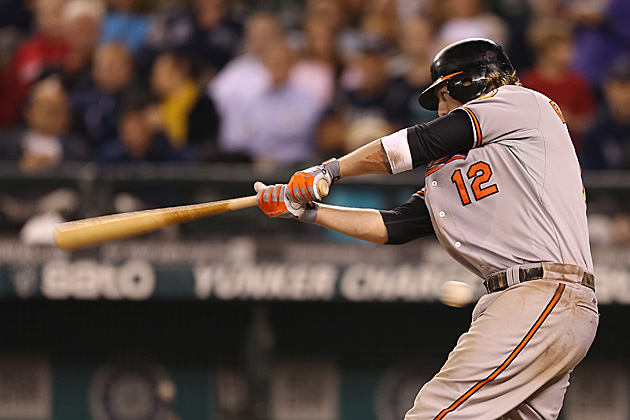
 As for the Orioles, the starting rotation was anchored by Jake Arrieta, a pitcher who entered the season with 40 career starts and a 4.88 ERA. The rest of the rotation was comprised of Tommy Hunter, Jason Hammel, Brian Matusz, and Wei-Yin Chen, a Taiwanese import who had never pitched in the Major Leagues. Only Hammel was borderline worthy of a rotation spot. Jim Johnson, a converted starter, would be the closer, after making 69 relief appearances in 2011, with nine saves. He had a career strikeouts per nine innings rate of 5.87, but had been a pretty consistent middle reliever and setup man. The offense had some exciting young players in Adam Jones and Matt Wieters, but Nick Markakis was coming off of the least productive season of his career and Brian Roberts, once viewed as one of the top second basemen in the game, found himself on the disabled list in Spring Training with concussion symptoms. Unlike the A’s, the Orioles had not had a major roster turnover during the winter, so, there weren’t many unknowns.
As the season played out, two things were clear for each team. With the A’s, Billy Beane had built to the team’s strength at home, filling the rotation with fly ball pitchers that would thrive in the heavy marine air in Oakland and that the team walked a lot, hit a lot of home runs, and struck out a lot. For the Orioles, they, too, hit for a lot of power and used the hitter-friendly conditions of Camden Yards to their advantage and that their bullpen was damn good.
In each case, both teams were frustrating at times and had their warts. The A’s pitching staff would finish the season with a 3.08 ERA at home and a 3.95 ERA on the road. The A’s were 50-31 at home, tied for the second-best mark in the American League. They were sixth out of 14 in home runs hit with 195, fourth in walks, with 550, and first in strikeouts, with 1,387.
Like the A’s, the Orioles hit home runs and struck out a ton. The Orioles were second in home runs, with 214, slightly below league average in walks with 470, and third in strikeouts with 1,315.
Positive things started happening for both teams. In the case of Oakland, Tommy Milone and Jarrod Parker became rotation fixtures, replacing Gonzalez and Cahill with quality innings and just enough to help the A’s win. Ryan Cook replaced Andrew Bailey as the closer. Yoenis Cespedes became one of the better right handed hitters in the American League. Josh Reddick hit 32 home runs.
In the case of Baltimore, Jim Johnson became one of the most reliable closers in baseball, helping the Orioles to a 29-9 record in one-run games. Adam Jones took the next step, hitting 32 home runs en route to the best season of career. The pitching staff navigated their way through the season, helped by the bullpen and the mid-season acquisition of Joe Saunders. The Pythagorean win-loss record is a metric that uses run differential to calculate what a team’s win-loss record should be. The Orioles’ Pythagorean win-loss record was 82-80. The team finished 93-69 with just a plus-7 run differential.
While these two improbable runs were going on, front offices around the Major Leagues were trying to figure out how these two teams did it. The A’s had blown up their team the previous offseason, yet they knocked off two teams with significantly higher payrolls to win their division. The Orioles were in the land of the giants, with the Yankees, Red Sox, and Rays, yet somehow managed to sneak into the playoffs. It was puzzling, confusing, and seemed like an anomaly. But it symbolized something else, too. Hope.
It seemed that one of the key steps of the process was finding the right manager. The A’s had Bob Melvin, a well-respected baseball mind who was the 2007 National League Manager of the Year with the Arizona Diamondbacks. The Orioles had 13-year veteran, and two-time American League Manager of the Year, Buck Showalter.
Indians General Manager Chris Antonetti found that manager immediately after the end of the 2012 season when he hired Terry Francona.
With Francona in the fold, the next step was finding the personnel. Both the A’s and the Orioles used every avenue available – drafting and developing, trading, and free agency. The Indians had a start in two of those three areas, drafting and developing Jason Kipnis, Lonnie Chisenhall, and Vinnie Pestano and trading for Asdrubal Cabrera, Michael Brantley, Justin Masterson, Chris Perez, and Carlos Santana, among others. By the blueprint that the A’s and Orioles put together, the Indians needed power, young pitching, and an intangible.
The A’s and Orioles had an intangible tied to the ballparks they call home. The A’s had used their distinct home field advantage to get pitchers that would play well in their ballpark, with its vast amount of foul territory and heavy air that knocked down fly balls. The Orioles used their home field advantage to get fly ball hitters that would thrive in the humid Baltimore summers. Progressive Field offers no clear advantage, as it is a pretty neutral ballpark for both hitters and pitchers.
The ball really started to roll at the Winter Meetings in Nashville, TN, when the Indians started stealing headlines with their aggressive pitches towards free agents. This was out of the norm for the Indians and their ownership, which has been criticized for their penny-pinching ways in the past. Initially, the Indians looked like sellers, offering up two of the top trading chips on the market, Asdrubal Cabrera and Shin-Soo Choo. As rumors about the two subsided, the Indians were linked to free agent outfielder Shane Victorino. On the surface, a Victorino signing made no sense. He was entering his mid-30s and the Indians appeared to be in a rebuilding mode, since the expectation was that Cabrera and/or Choo would be traded. The Indians were also linked to free agent Kevin Youkilis, another head scratcher, with the Indians best served to give the third base reins to Lonnie Chisenhall in a season where contention looked unlikely.
Ultimately, Victorino shunned the Indians’ offer of more total money to sign with the Red Sox. Youkilis did the same, signing with the Yankees. For the time being, the Indians still held on to Cabrera and Choo. Undeterred, Antonetti and his staff moved forward with their plans.
 On December 9, the first domino fell as the Indians and free agent slugger Mark Reynolds agreed to a one-year deal. Reynolds, ironically, a former Oriole, added right handed power to the Indians lineup, at the expense of a lot of strikeouts. ISO, or isolated power, is the difference between slugging percentage and batting average. Slugging percentage is calculated with the formula (Total Bases / At Bats). From 2007-12, Mark Reynolds has the 19th highest ISO of any batter in the Major Leagues. He hits home runs, bats for a low average, strikes out often, and sees a lot of pitches. The average walk percentage (BB%) in the Major Leagues from year to year is between 8-8.5%. For his career, Reynolds is at 11.9%.
Two days later, on December 11, Antonetti pulled the trigger and sent one of his two bullets flying from the chamber. Shin-Soo Choo and Jason Donald were traded to Cincinnati for Drew Stubbs and Didi Gregorius. Gregorius, a slick-fielding shortshop prospect, was then traded to Arizona, along with Tony Sipp and Lars Anderson, for Trevor Bauer, Matt Albers, and Bryan Shaw. It was a transaction that sent shock waves through baseball. Bauer, one of the game’s top pitching prospects, was the ace that the Indians’ farm system lacked after the infamous Ubaldo Jimenez/Drew Pomeranz trade in 2011. While Indians fans rejoiced at getting Bauer for essentially one season of Shin-Soo Choo, the trade sent mixed signals about the direction of the team.
Choo was one of the Indians’ top offensive contributors on a yearly basis. With the trade, the Reynolds signing appeared to have little or no value because the Indians had a gaping hole in right field that they couldn’t fill with somebody in the organization and they shelled out $6 million to Reynolds to play for a non-contender. Getting Bauer was great for the future of the ballclub, but it left questions about what 2013 would hold. At its core, the Bauer acquisition filled an organizational hole left by the Jimenez trade and years of poor drafting that had produced subpar starting pitching in the system and that was something to be happy about.
As it turned out, there was a plan all along. Antonetti reloaded his proverbial gun, not with players, but with money. Less than two weeks after the Choo trade, the signing of Nick Swisher was announced. The Indians were linked to Swisher during the Winter Meetings, but none of the reports had been taken very seriously. Swisher, who hits for power and walks at a well above average rate, also strikes out with above average frequency.
The plan became clear. The Indians were going to be an offense built on walks and power, while dealing with a lot of strikeouts. Looks pretty similar to the Oakland plan, no? In 2012, the Indians drew the third-most walks in the American League, with 555. They parlayed that into the second-fewest runs with just 667 and the second-lowest slugging percentage at .381. They had the third-fewest strikeouts in the American League, with 1,087, but that obviously didn’t help.
The caveat about power hitters is that they strike out – a lot. Sabrists, people who subscribe to advanced statistics (sabermetrics) to measure player worth, argue that strikeouts aren’t that much worse than any other kind of out. Obviously, the difference between a strikeout and a fly ball with a runner on third and less than two outs is quite big. On the whole, however, outs are outs, regardless of how the batter is retired.
With high strikeout guys, there are three things to look for that will determine if the player is out-performing his strikeouts. One is walk percentage (BB%). High strikeout hitters, like Mark Reynolds, tend to see a lot of pitches. As a result, along with striking out at high rate, they will walk at a higher rate than most players. As stated above, the league average walk rate is between 8-8.5%. Very rarely will a player strike out on three pitches. The counts tend to run deeper with high strikeout hitters, so not only do those batters walk more, they also increase pitch counts and may force the opposition into their bullpen sooner.
Another is home run per fly ball percentage (HR/FB%). The reason sabrists will use HR/FB% instead of the raw home run total is because it provides context of sustainable power. A drop in HR/FB% could mean a bat speed issue or an injury, while a drop in home runs may just mean that the batter hit more line drives, possibly due to a swing adjustment. The league average for HR/FB% tends to be around 9%, with “great” being set at 15%. For his career, Mark Reynolds is at 20.6% and Nick Swisher is at 14.9%. As long as high strikeout hitters are hitting home runs when they make contact and elevate the ball, they will outhit some of their strikeouts.
Another is batting average on balls in play (BABip). Essentially, BABip is a batter’s average when subtracting strikeouts from at bats. While BABip is a useful stat in some respects, because it can attribute bad seasons to bad luck or good defense, it will have some fluctuations from year to year. That’s why the average range for BABip is between .290 and .310. For Swisher, his career BABip is .292, with a career high of .335 and a career low of .249. For Reynolds, his career BABip is .306, with a career high of .378 and a career low of .257. Both players fall into the average range, which is good, considering that neither of them, especially Reynolds, hit for a particularly high average.
When you factor all three things together, you can see that, despite the high strikeout totals, Swisher and Reynolds are both out-performing their strikeouts by enough to be valuable offensive players. Keep in mind that Billy Beane, the GM of the Oakland A’s, was one of the first GMs to use these sabermetric statistics, as portrayed in the book Moneyball by Michael Lewis. So, naturally, these types of players fit the Oakland plan, which the Indians appear to be striving for this offseason.
With the in-house players of Carlos Santana, Jason Kipnis, Asdrubal Cabrera, and Lonnie Chisenhall all having varying levels of power and the ability to walk, Swisher and Reynolds should fit right in.
 Then, there’s the Orioles approach. The Orioles’ offense looked fairly similar to what the Indians are constructing, with the power, but without the walks. Where the Indians and the Orioles have more similarities is with the pitching staff. Like the Orioles in 2012, the Indians’ rotation lacks household names, a true #1 starter, and is a major uncertainty. On January 2, the Indians added a veteran that should provide them with right around league average production in Brett Myers to help bolster the rotation. League average production is no guarantee from any Indians starter, so any experienced arm with a track record of some success is helpful. The Indians have also signed Scott Kazmir and Daisuke Matsuzaka to minor league deals, something very reminiscent of recent offseasons. These are no-risk signings with potential reward.
Also like the Orioles, the Indians bullpen is a strong unit with a lot of reliable arms. The Indians were 24-12 in one-run games and were four games better than their Pythagorean win-loss record, despite a minus-178 run differential. The Indians exceeded their Pythagorean win-loss mark by five games in 2011, with a 30-26 record in one-run games. Couple these numbers with the overall performance of the main contributors in the Indians bullpen and it’s clear to see how that is a strength for the Indians.
The example of the 2012 Orioles is the exception and not the norm. Rotations like theirs, and like the projected 2013 Indians rotation, generally don’t find their way into the playoffs. But, winning close games and not blowing the games you are in a position to win is a must to overcome questionable starting pitching. Having an offense that hit home runs certainly helped the Orioles, as multi-run home runs help erase deficits faster than having to string together four or five hits to score more than one run and increase a pitcher’s margin for error.
So, in essence, the Indians’ offense looks like the A’s offense and the Indians’ pitching staff looks like the Orioles’ pitching staff. All that was missing was the intangible.
 Michael Bourn is the intangible. The Indians shocked the baseball world on February 11, announcing the signing of free agent outfielder Michael Bourn. Bourn was one of the last impact free agents on the market, left unsigned because of draft pick forfeiture rules and his notoriously rigid agent, Scott Boras. In Bourn, the Indians get one of the top defensive center fielders in baseball over the last five seasons, a guy who has stolen 40 or more bases in each of the last five seasons, and a player who can put pressure on opposing defenses.
As complementary effects to the Bourn signing, the Indians announced that they will move below average outfielder Nick Swisher to first base, where he is slightly above average, Mark Reynolds, who is a negative defensive player, to the designated hitter role, and Bourn will be flanked by Michael Brantley in left field and Drew Stubbs in right field. That improves the overall team defense and gives the Indians one of the fastest and best defensive outfields in baseball.
Even though the statistical value of a stolen base is up for debate between old school baseball thinkers and sabrists, it probably won’t be a bad thing that the Indians should lead the American League in stolen bases this season. The A’s stole 122 bases last season, a number that the Indians should easily surpass, and the Orioles stole just 58. That’s the intangible that the Indians needed to compensate from their lack of a home field advantage.
As you can see, the Indians are taking a cue from two teams that defied the odds and made the playoffs while playing in two of baseball’s most competitive divisions. Nobody will argue that the AL Central is anywhere near as strong as those two divisions, so the Indians are going to take their chances and see if they can be the 2013 version of those two unlikely playoff teams. Based on the way the offseason has gone, this appears to have been the plan all along and one that could provide for an exciting summer of baseball in Cleveland.