
 Lately, the only way to avoid hearing about the first place Indians' disturbingly low attendance numbers is to sequester yourself in a peaceful place far from the rest of humanity — like Progressive Field. Zing! In all seriousness, though-- for both the disillusioned fans and the die-hard devotees who berate them-- those swaths of empty seats are raising a lot of questions: Is it the ticket prices? The bad weather? The low payroll? The tumultuous five years since the Tribe’s last playoff run? Basically, why aren’t people getting their asses to the ballpark? Well… while others are content to ask, The Opposite Field seeks to answer. Presenting... the Unofficial Metric of Fairweather Fandom!
If yee be timid in the face of obsessively detailed statistical analyses, tread no further. For the Fairweather Fan Metric is—for lack of a better term— numerically psychotic. The goal was simple. By indexing some of the top excuses for low ballpark attendance, and how these factors affect all 30 Major League ball clubs, we can finally get a clearer sense of how unique the Indians’ circumstances are—and by further extrapolation—how fickle Cleveland fans are compared to the rest of the league.
To come up with our final Fairweather Fandom Standings, a three-step process is required.
1. Tally Up How Each MLB Team Ranks in 7 “Fan Attendance Discouragement” Categories, aka FAD’s
2. Use the Team’s FAD Number to Establish Its’ “Forgivable Attendance Rate” (FAR)
3. Compare That FAR to Each Team’s Actual 2012 Attendance Rate to Get their +/- Fairweather Fan Rating.
Simple, right? No, of course it isn’t! And there’s loads of shady math in there, too. But when we’re done, we’ll know which fans keep the faith in trying times, and whether the Tribe’s fan shortage is understandable or unforgivable.
Introducing the Fan Attendance Discouragement (FAD) Categories
So, you want to calculate how much a team is crushing its fans’ spirits before even taking the field? No problem. These are seven of the most often cited reasons that fans elect not to go see their team play in person.
 1. Team Payroll (PAYRL): We hear this one routinely with the Indians. “Dolan is cheap,” etc. When a team spends big dough on free agents, the fans tend to feel like a commitment to winning has been communicated. The 2012 team payrolls below were yoinked from USA Today.
2. Ticket Prices / “Fan Cost Index” ($FCI): The people over at fancostexperience.com came up with each MLB ballpark’s average costs based on the prices of four (4) adult average-price tickets, two (2) small draft beers, four (4) small soft drinks, four (4) regular-size hot dogs, parking for one (1) car, two (2) game programs and two (2) least expensive, adult-size adjustable caps.
3. TV Market Size (TV): Teams in big cities ought to have an easier time filling a stadium, right? Here, our market sizes were determined by Nate Silver at Baseball Prospectus, who helped split up market share for cities with two teams.
4. Postseason Drought (PSD): When your season always ends before the leaves change, your fans may become disenchanted.
5. Ballpark Age (PRK): Unless Babe Ruth played in your park, newer is always better.
6. Average Temperature (TEMP): Here we’re just using average temperatures for April/early May in the MLB markets, with the understanding that dome/roof parks (R) are immune to such concerns.
7. 2012 Winning Percentage (2012): Obviously, a winning team is a more watchable team. These stats are through May 16, 2012.
Now, using these FAD categories, it’s time to see how all the MLB teams stack up. Below, each team is ranked from 1-30 in all seven columns (with 1 being best, 30 worst). These rankings appear in parentheses next to the stats themselves. We then add those 7 separate rankings together for each team (Rotisserie League style) to figure out their Fan Attendance Discouragement (FAD) total. The higher your FAD number, the more excuses your fans have NOT to show up.
The Fan Attendance Discouragement Standings (as of May 16, 2012)
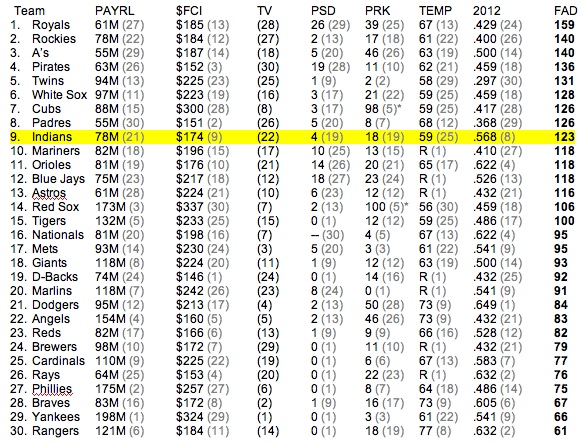
*Fenway Park and Wrigley Field were given the honorary age of 4 years, as their legendary status keeps them perpetually "newish."
So, scientifically speaking, looks like we might be on to something so far, eh? It’s hard to argue that any fan base has more discouragement to overcome than that of the Indians’ Central Division whipping boys, the Kansas City Royals (FAD 159). Even with a fine crop of young hitting prospects, a slow start to the 2012 campaign has added on to nearly three decades of playoff-free baseball—played in a nice but old ballpark in a small market. On the opposite end of the spectrum, the two-time defending AL Champion Texas Rangers (FAD 61) have a hefty payroll, warm weather, and a hot start to keep their fans satisfied.
Meanwhile, there’s the Indians, floating around as the ninth worst FAD team in baseball. Comparatively speaking, doesn’t look like the cost of a ballgame ought to be a huge deterrent. Progressive Field is the ninth most affordable ballpark experience as FCI goes. The biggest factor separating the Indians from the other bottom feeders, though, is that winning record six weeks into the 2012 campaign. Of the bottom 10 teams in FAD, Cleveland is the only one coaxing their fans with an above .500 record.
The “Forgivable Attendance Rate” vs. “Actual Attendance Rate”
 Ok, now it’s shady math time! Somehow, we’re going to use the FAD totals from above to come up with an estimate for what each team’s attendance percentage ought to be—presuming fans reacted solely to the circumstances laid out before them. In other words, this is a world without irrational devotion nor extreme cynicism.
To establish these Forgivable Attendance Rates (meaning the percentage of a stadium's seating capacity that should be filled within reason), we’re going to make up a somewhat arbitrary but entertaining formula.
First, we know that the average FAD is close to 100 (if the Indians ranked 15th in all 7 categories, that’d be 105, so you get the idea). We also know that the average attendance percentage in MLB is roughly 67%, which we’ll round to 70%. So, we’ll correlate the two. If a team has a 123 FAD (like the Indians), it means they are 23% above the average FAD of 100. With fans discouraged 23% more than the league average, we’ll also calculate 23% of 70 to see how far the attendance will forgivably drop in accordance [70 - (70 x .23)]. This comes out to 53.9 or rounded up, 54. So our Forgivable Attendance Rate (FAR) for the Indians is currently 54% of Progressive Field’s roughly 43,000-seat capacity. Anything below that 54% mark says that Indians fans are staying away in higher numbers than the Tribe’s various problems would rationally excuse.
Similarly, if a team has a FAD below 100, they will have a Forgivable Attendance Rate that is higher than 70%. The Rangers' 61, for example, is 39% below FAD average of 100, so [70 + (70 x .39)] gives Texas a Forgivable Attendance Rate of 97%. If they aren’t packing the house, it’s the fans fault more than the team’s.
So, let’s see how the Tribe fans are really doing and how they stack up with other FAD-heavy fan bases when it comes to keeping the faith.
The Fairweather Fandom Chart (as of May 16, 2012)
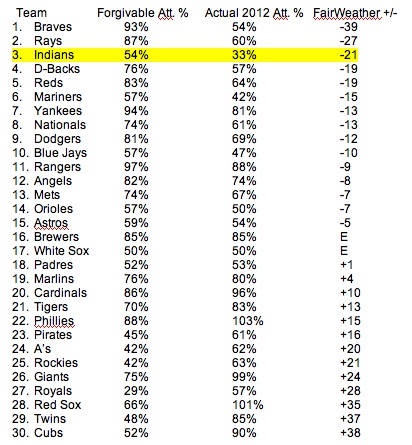
And there you have it. According to the amazing Fairweather Fan Metric, Indians fans are slightly LESS apathetic than two of the most notoriously disinterested fan bases in the game—the retirees in Tampa and the couldn’t-even-sell-out-World-Series-games contingent in the ATL. This moral victory does not change the fact that the Indians have—BY FAR—the lowest attendance percentage in Major League Baseball this season. At 33%, Cleveland’s nearest competition is Seattle at 42%. And as this week’s two-game series showed, there’s not much to be excited about in Seattle.
Other interesting aspects of the Fairweather Chart... As you would expect, Cubs and Red Sox fans are practically immune to FAD problems. They scored +38 and +35 Fairweather scores respectively, as attending baseball games is just engrained in the cultures of these towns. That said, anyone on the North Side of Chicago can tell you that, while the Cubs might be selling 90% of their tickets, far fewer than that are actually sitting in the seats.
Meanwhile, when it comes to fans in very similar situations to Cleveland (low payroll, long playoff droughts, small market, etc.), the trend of abandonment is strangely not as prevalent. The Royals fans—whom we would have forgiven for filling up a third of Kaufman Stadium—are filling 57% of it. The Twins are still in “new ballpark mode” and selling 85% of their seats despite having the worst record in baseball. Even the lowly Athletics and Pirates are well exceeding their Forgivable Attendance Rates and drawing over 60%.
So, in the long run, perhaps this whole Fairweather Metric nonsense has only created more questions, rather than answering any. Maybe next time I will include a category called “LeBron Related Sports Ennui” and see if that does the trick.