


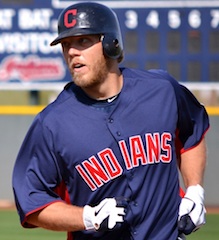
 Perhaps you’re the sort of bloke that reads baseball box scores before St. Patty’s Day. And maybe Shelley Duncan’s torrid first seven at-bats of the spring have you thinking the Indians’ left field problem has already been solved. If so, I simultaneously envy you and pity you. For while you are a dreamer in a world full of cynics, you are also undoubtedly a mouth-breathing halfwit.
Now, to be fair, it’s hardly accurate to say that Spring Training statistics “don’t matter.” Sure they do. This whole circus in the desert only really has one point these days, and that’s to let bubble players battle for roster spots. Most pro athletes now keep up a year-long conditioning routine (unlike in the ‘40s when they had winter jobs), so the whole “training” part of Spring Training is really secondary to watching a collection of doe-eyed rookies and grizzled veterans desperately trying to make an impression. The month-long audition process is judged partly on the subtle details, of course, but when it comes down to it, the guy who hits .444 with a few bombs will usually edge out the one who kept getting the string pulled on him by random Triple-A journeymen. So, in this sense, Shelley Duncan’s Cactus League heroics certainly could increase our odds of seeing Sloth back in Cleveland in April. As for indicating anything about what he may do while up here, however…
Spring Training Stats vs. Regular Season Stats: A Study of Apples and Orangutans
After wondering about this crap for years, I was pleased to find that MLB.com is now offering complete Spring Training statistics dating back to the 2006 season. This allows us the rare treat of revisiting the numerous occasions we’ve lied to ourselves in the month of March, in-between swigs of Guinness and four-packs of Cadbury Eggs.
I know what you’re saying to yourself: “I’m smart. I never really put any stock into spring stats.” Sure, fine. Whatever. You’ve never once said, “man, you gotta love how Fausto is throwing this spring.” You’re a genius. So be it. But the fact remains, not even the most devoted spring-ignorers among us likely grasp just how wide the gap often is between preseason and regular season success. So, because I was home sick for a day and had nothing better to do, I’ve created a Cleveland Indians Spring Training Leader Board, covering the last six pre-seasons (2006-2011) in two of the most popular roto stat categories of the moment: OPS (on-base percentage plus slugging percentage) for hitters and WHIP (walks and hits allowed per inning) for pitchers. Both lists feature the top 15 spring performances in each category over that six-year timespan, meaning that one player can show up multiple times if he excelled in more than one spring season. Next to each player's name is the year in question, followed by a comparison of his spring numbers (on the left) and eventual regular season numbers (on the right).
Is it really fair to compare a guy’s numbers in 20 games vs. scrubs to his stats in 150 games vs. elite talent? Nope, it sure isn't. But isn’t that exactly the point?!
Indians Spring Training OPS Leaders, 2006-2011 (Min. 30 ABs)
Name………..Year…………Spring OPS….. Regular Season OPS
 1. Grady Sizemore (2008):…..... 1.256 …………. .876
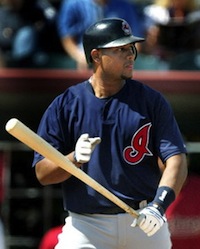
2. Travis Hafner (2006): …...….. 1.242 …………. 1.097
3. Jason Dubois (2006): …........ 1.171 ………… .656
4. Travis Buck (2011): ……...…. 1.165 ………… .617
5. Shin-Soo Choo (2010):......… 1.143 ………… .885
6. Grady Sizemore (2010):…..... 1.114 ………… .560
7. Chad Huffman (2011):…...…. 1.111 …………. N/A
8. Mark DeRosa (2009):…...….. 1.109 ………… .752
9. Aaron Boone (2006):…......… 1.081 ………… .684
10. Matt LaPorta (2009):…....… 1.050 ………… .750
11. Jhonny Peralta (2009):…… 1.035 ………… .690
12. Asdrubal Cabrera (2011):… 1.026 ……….. .792
13. Ben Francisco (2008):…….. 1.021 ……….. .770
14. Andy Gonzalez (2008):…… 1.019 ……….. .700
15. Mike Rouse (2007):……….. 1.018 ……….. .334
To have expected any of the guys above to keep up their ridiculous spring paces during the regular season would have been beyond silly, of course. These are hot streaks captured in a small sample size. And whether we were talking Grady Sizemore in his prime or the mighty Jason Dubois, an OPS over 1.000 just doesn’t happen often (only Jose Bautista and Miguel Cabrera pulled it off last year). So, what if we get a little more reasonable and ask, “how many of these players hit for an OPS within 200 percentage points of their spring stats?” The answer is only one: Travis Hafner in his monster 2006 season.
Okay then. Let’s expand that gap to finishing within 300 percentage points of your spring numbers-- a pretty damn wide net to fall into. Turns out, you still only get 5 of the 15 players managing that feat: Hafner in ’06, Shin-Soo Choo in 2010, and—by narrow margins—Ben Francisco and Matt LaPorta in limited duty (2008 and 2009, respectively) and Asdrubal Cabrera in his breakout season last year.
Maybe we're just going about this the wrong way. Fangraphs.com says an "average" MLB OPS is .730. So, if we simply set the bar for our Spring Training studs at the goal of .730, how many wound up having "average" regular seasons? Answer... still less than half: 7 out of 15. So, more times than not, your bigtime spring sluggers not only don’t go on to huge regular seasons… they tend to be Travis Buck.
Just for fun, let’s look at the leader board for Indians Spring Training homeruns between 2006 and 2011, as well. It’s hilarious.
5 HRs
 Kelly Shoppach (2009)
Andy Gonzalez (2008)
Andy Marte (2008)
Grady Sizemore (2008)
Travis Hafner (2006)
4 HRs
Travis Buck (2011)
Luis Valbuena (2011)
Casey Blake (2007)
David Dellucci (2007)
Aaron Boone (2006)
Ryan Mulhern (2006)
Don’t tell me you forgot about the brothers Andy (Marte and Gonzalez) going yard like gangbusters back in ’08? And we all know Luis Valbuena went on to blast 30+ dingers for the Tribe last season.
Indians Spring Training WHIP Leaders, 2006-2011 (Min. 10 IP)
Name………..Year……..…Spring WHIP….. Regular Season WHIP
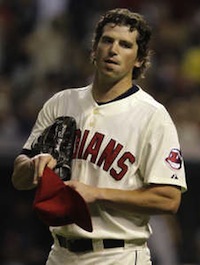
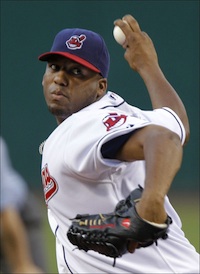 1. Fausto Carmona (2010):…...… 0.65 …………. 1.31
2. Jake Westbrook (2008):…...…. 0.67 …………. 1.15
3. Adam Miller (2007):…….…..… 0.79 ……...….. N/A
4. Fernando Cabrera (2007):..…. 0.83 …………. 1.86
5. Vinnie Chulk (2009):………..... 0.83 …………. 1.67
6. Jamey Wright (2010):….….…. 0.87 …………. 1.37
7. Scott Sauerbeck (2006):…..… 0.91 …………. 1.58
8. Frank Herrmann (2011):…..… 0.94 …………. 1.54
9. Yohan Pino (2010):………..… 0.94 ………….. N/A
10. Jensen Lewis (2009):…...… 1.00 ……...….. 1.37
11. Fausto Carmona (2006):….. 1.08 ……..….. 1.59
12. Jason Davis (2006):……….. 1.10 ……..….. 1.46
13. Tom Mastny (2007):……….. 1.13 ……..….. 1.65
14. CC Sabathia (2007):………. 1.14 ……........ 1.14
15. Jake Westbrook (2007):...… 1.14 ……..….. 1.41
WHIP seems like as good a stat to focus on in the spring as any, as it should theoretically indicate which hurlers have their shit together, so to speak, regardless of whether they’re dipping into their full repertoire of pitches or unleashing their most electric stuff. Basically, if you’re not walking people and you’re not giving up many hits, you’ve instantly got a leg up on all the spring invitees still trying to work out their various mechanical quirks on the fly. So, it wouldn’t seem misguided, necessarily, to presume that a pitcher keeping men off the bases in March could at least do a decent job of it in April and onward. Once again, though, the leader board says otherwise.
Last year, the average American League pitcher had a WHIP around 1.36—which is bad, but we’ll set the bar there anyway. Of the 15 pitchers above, only three managed to wind up following their great springs with a decent/average WHIP in the regular season, and one of those was Jake Westbrook’s 2008 campaign, when he got hurt and basically missed 90% of the season.
As for how many pitchers managed to finish within a substantial 20 percentage points of their spring numbers, the answer is ONE. And that one is CC Sabathia, who not only came close to his spring WHIP, he matched it en route to the 2007 Cy Young Award.
Beyond that, only Westbrook (in 2007, this time) came within 30 percentage points in terms of spring vs. regular season WHIP. And only Jensen Lewis and Jason Davis managed to get within 40 points!
Again, nobody in their right mind was expecting Roberto Hernandez Heredia to keep his WHIP under 0.70 in 2010, nor was Fernando Cabrera believed to have his control problems cured in 2007. But the actual magnitude of the gaps between many of these sterling Spring Training stats and reality goes beyond a simple market correction. It’s eyeball popping. And as Vinnie Chulk, Tom Mastny, and poor Adam Miller can confirm, it’s pretty strong evidence against putting too much stock in what you’re seeing in Goodyear right now.
- NBA Announces 2013-2014 Schedule
- Browns Ink Sharknado
- Sharknado A No-Show For Rookie Camp
- Trent Richardson Out Until Training Camp
- Browns Sign Brandon Jackson
- Carrasco Suspended Eight Games
- Browns Add to Wide Receiver Depth with David Nelson
- Browns Need to Learn from Past Draft Mistakes
- Browns Release Chris Gocong and Usama Young
- Browns Missing on Grimes Disappointing, But Not The End
The TCF Forums
- Chris Grant's first 3 drafts
Kingpin74 (Tuesday, January 21 2014 10:13 AM) - The 2014 Offseason Thread
googleeph2 (Tuesday, January 21 2014 9:36 AM) - 2015 Recruiting
furls (Tuesday, January 21 2014 6:57 AM) - Mike Brown
YahooFanChicago (Monday, January 20 2014 11:15 PM) - Movies coming out
HoodooMan (Monday, January 20 2014 9:34 PM) - 2014 Hoops Hockey Hijinx
jpd1224 (Monday, January 20 2014 4:44 PM) - 2014 Recruiting
jclvd_23 (Monday, January 20 2014 2:26 PM) - Wish List - #4 Pick
Hikohadon (Monday, January 20 2014 1:26 PM) - Official- Browns Coach Search/Rumors
OldDawg (Sunday, January 19 2014 6:48 PM) - #1 overall pick Anthony Bennett
TouchEmAllTime (Sunday, January 19 2014 1:28 PM)